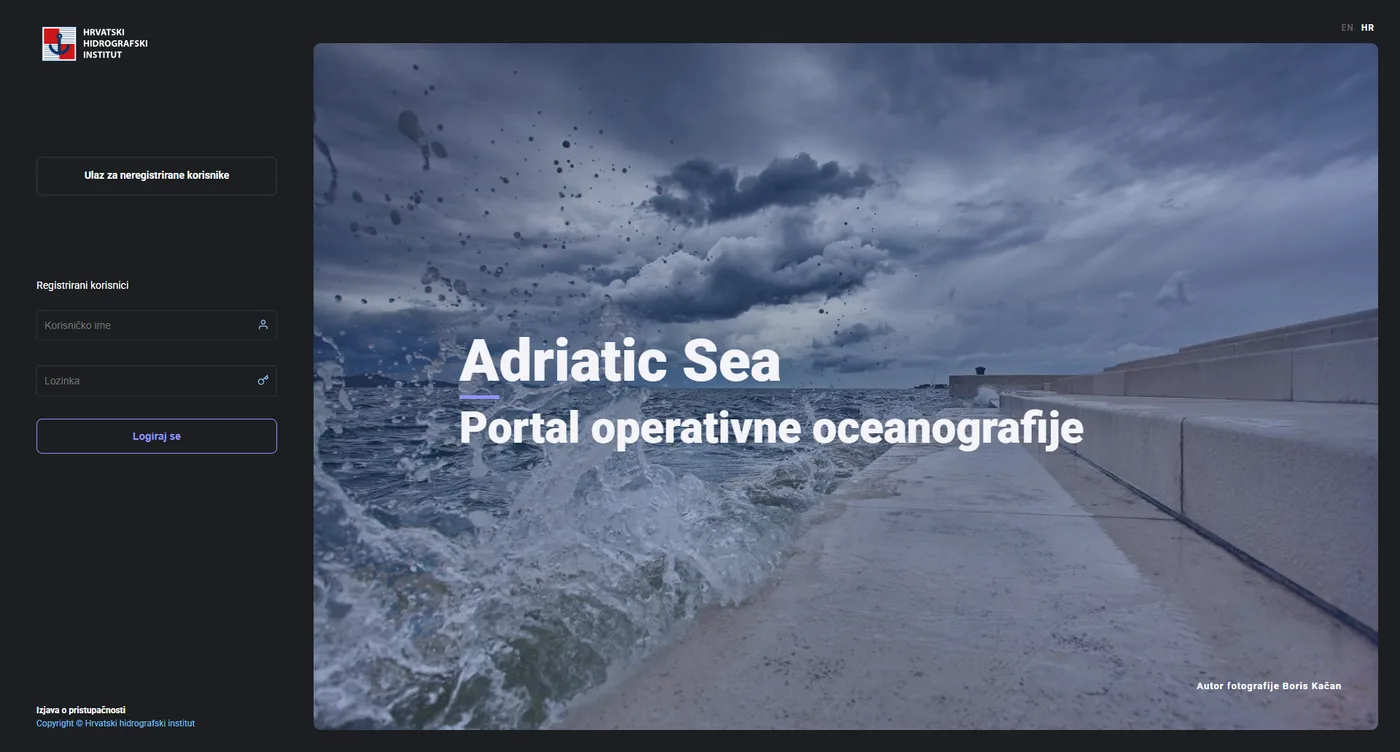
Platforma za praćenje izrađena za Hrvatski hidrografski institut koja prikuplja očitanja iz mreže postaja duž jadranske obale i objavljuje ih uživo. Datoteke instrumenata pristižu iz svake postaje; javne stranice postaja prikazuju najnovija očitanja morskih mijena, valova, vjetra i tlaka, svako na vlastitom grafikonu koji se osvježava uživo. Rad obavljen za institut — platforma, mreža postaja i podaci pripadaju institutu.
Adriatic Sea vodi mrežu obalnih nadzornih postaja Hrvatskog hidrografskog instituta. Osoblje upravlja postajama, učitava podatke instrumenata i konfigurira alarme iza prijave; javni portal svima prikazuje određene postaje, a kartografski izvor prenosi najnovije očitanje svake na kartu obale uživo.
Platforma je oblikovana prema instrumentima. Pet vrsta postaja — morske mijene, valovi, vjetar, tlak i meteorološke — svaka čuva očitanja u vlastitom obliku jer ne mjere ništa zajedničko. Očitanja morskih mijena svode se na upravljanu referentnu razinu prije prikaza, alarmi označavaju vrijednosti izvan granica bojom i e-poštom, a cijelo sučelje radi na hrvatskom i engleskom.
Javne stranice postaja ostaju aktualne tako što od poslužitelja, na odbrojavanje, traže samo očitanja novija od posljednje točke već na grafikonu, a svaka stranica prikazuje vrijeme posljednjeg podatka i vlastiti sat postaje te označava očitanje koje predugo nije osvježeno.
Rad obavljen za institut — platforma, mreža postaja i podaci pripadaju Hrvatskom hidrografskom institutu.
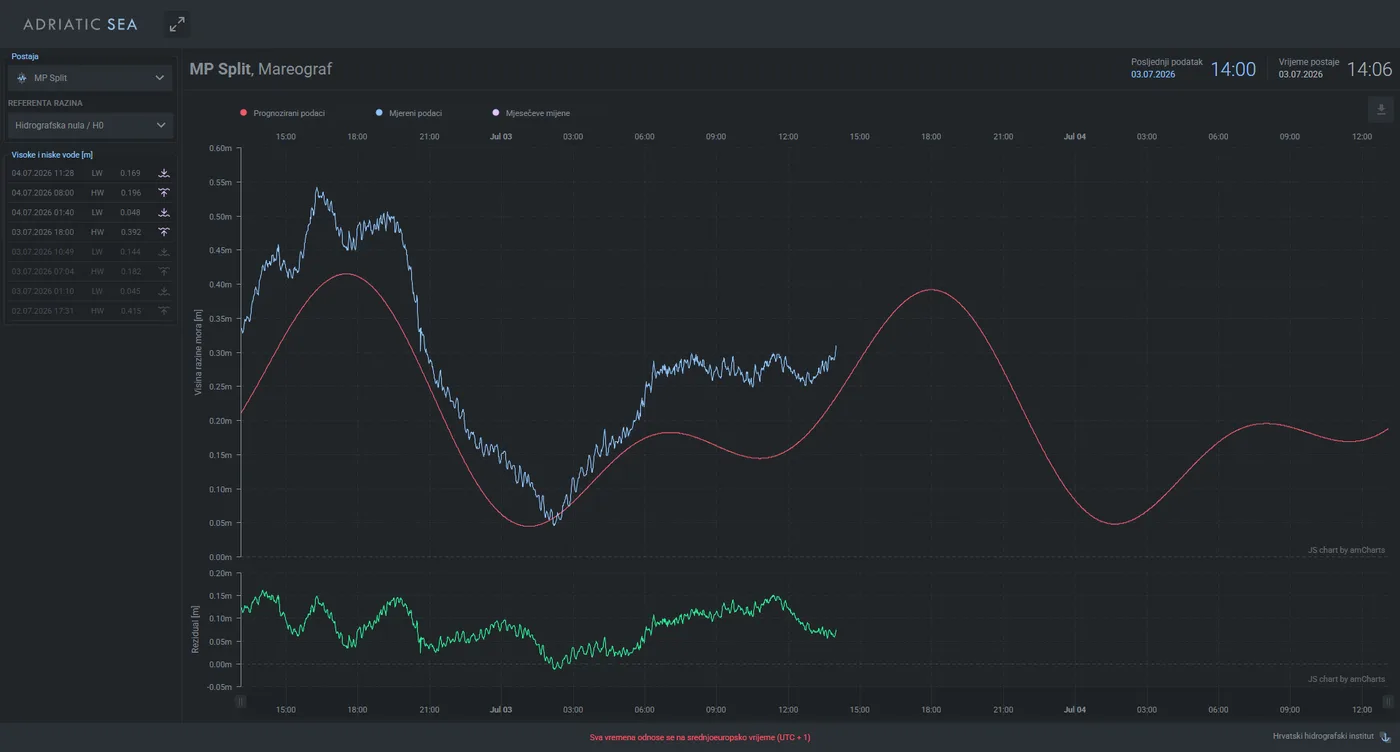
Postaja za morske mijene iscrtava ono što senzor mjeri naspram predviđene mijene za iste sate, oboje očitano prema odabranoj referentnoj razini. Izmjerena i predviđena linija razilaze se točno ondje gdje more ide iznad ili ispod onoga što tablice očekuju, a uz grafikon stoji popis sljedećih visokih i niskih voda.
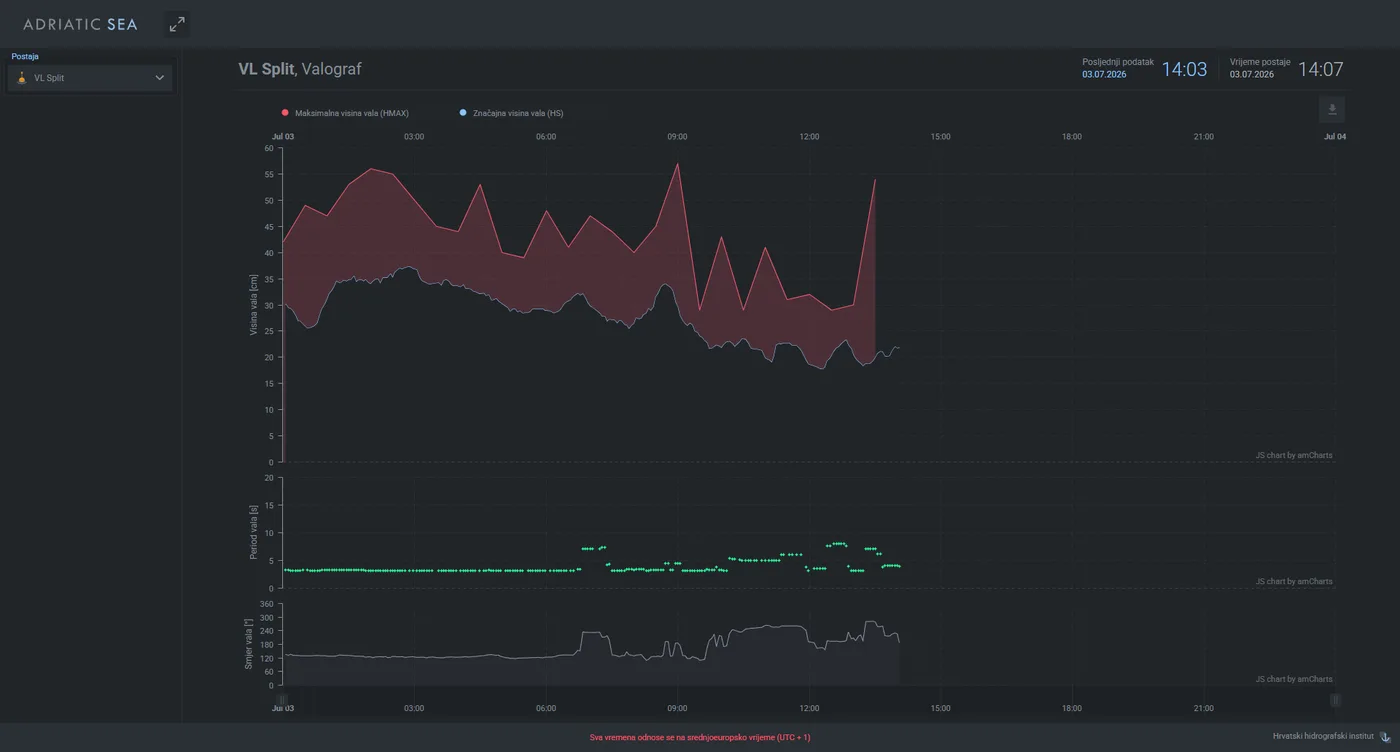
Svaka stranica postaje osvježava se na odbrojavanje. U svakom ciklusu od poslužitelja traži samo mjerenja novija od posljednje točke već na grafikonu i dodaje ih, umjesto da ponovno učita cijelu povijest. Vrijeme posljednjeg podatka i vlastiti sat postaje stoje na vrhu svake stranice, a očitanje koje predugo nije osvježeno posebno se označava, pa se praznina ne pomiješa s mirnim morem.